TLDR;
- LULU Margins Hit: Q1 FY25 net margin declined due to new tariffs (30% China, 10% other imports) and rising competition.
- Growth Outlook Trimmed: Lululemon slashed its full-year growth forecast (5-7%), leading to a significant stock drop.
- Competitive Headwinds: Increased competition from brands like Nike, Alo Yoga, and Vuori challenges Lululemon’s premium pricing.
- Strategic Pricing: Company plans modest price increases and supply chain shifts to mitigate tariff impact.
- International Strength: Despite US slowdown, strong international growth (especially China) offers a buffer.
LULU Q1 FY25 Results:
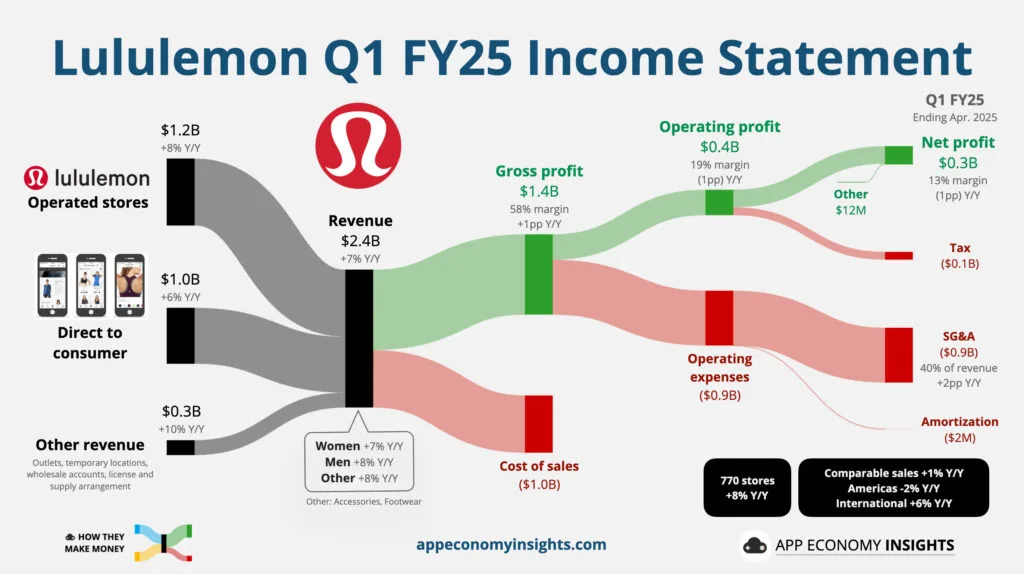
- Revenue: $2.4B (+7% YoY)
- Net Income: $314.6M (-2.1% YoY)
- Net Margin: 13.3% (-1.2% YoY)
- Cash Position: $1.3B
- Share Repurchases: $430.4M (1.4M Shares)

Why $LULU fell 20% after Q1 2025 results?
- 2025 Outlook 🔴: Estimated 5-7% growth compared to double digit growth in past – upsets investors.
- Reason – Tariffs, high competition in athletic wear, high inflation.
- Inventory up by 23% YoY 🔴- Indicates reduced demand and loosing market share.
- Alternatively this could be great move to stock up inventory to tackle tariff if things cool down with China.
- Net Margin 🟡- Down by 1-2% and that is negligible, considering high tariffs and inflation.
- Lululemon now assumes 30% duties on Chinese imports and 10% on others.
- Company plans modest price increases and supply chain efficiencies to offset the impact.
- Capex 🟡- Need to open physical stores which will lead to higher capex and operating cost.
- I think they can recover once tariffs situation stabilize and interest rates go down.

How do they make money?
- A Direct-to-consumer (DTC) model, selling premium athletic and athleisure apparel and accessories.
- Mission : Creating transformative products and experiences that build a community and enable people to live a life they love.
- Core Strategies:
- Product Innovation: Continuously expand core product assortments with a focus on technical fabrics and performance.
- Q1 2025 Growth: Men’s +8% YoY, Women’s +7% YoY, Accessories +8% YoY.
- Omni-Channel Guest Experience: Create a seamless and engaging shopping journey across physical and digital platforms.
- Key Metric: Digital (e-commerce) revenue represented 41% of total Q1 2025 revenue.
- Market Expansion: Aggressively grow the brand’s footprint and awareness outside of North America.
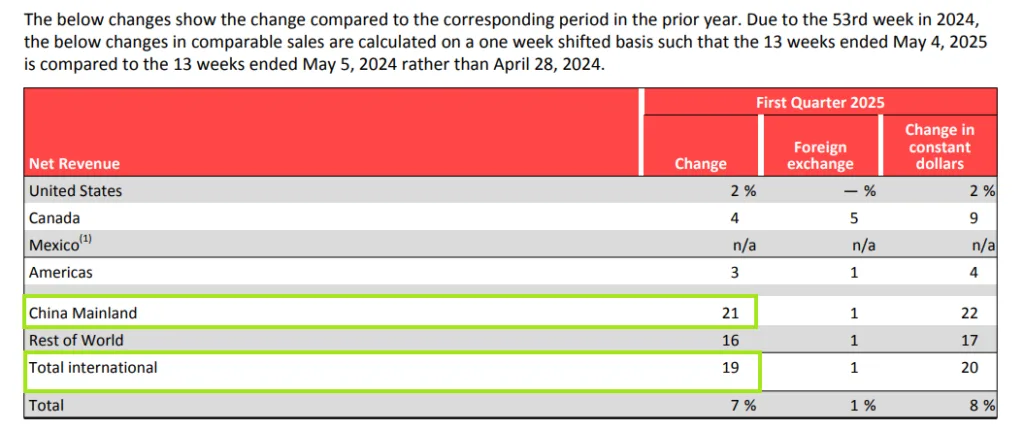
- Q1 2025 Growth: International revenue surged +19% YoY, with China Mainland growing +21% YoY.
- Product Innovation: Continuously expand core product assortments with a focus on technical fabrics and performance.

1. Company-Operated Stores (Physical Retail)
- How it works: Lululemon operates a global network of physical retail stores in prime locations.
- Total Company-Operated Stores: 770. | Net New Stores in Q1 2025: 3
- Total Gross Square Footage: Increased by 14% year-over-year.
- Competitive Edge: Stores act as community hubs that offer services like complimentary hemming and host fitness classes and local events to build brand loyalty.
- “Educators” (sales staff) are trained product experts, enhance premium guest experience and building lasting customer relationships that drive repeat purchases.
2. Direct to Consumer (DTC) E-commerce
- How it works: Revenue is generated through sales on Lululemon’s global websites and mobile apps offering buy online, pick up in-store.
- DTC channel generated $961M in Q1 2025, making up 41% of total company revenue.
- Competitive Edge: Owning digital channel allows LULU to control brand messaging, maintain premium pricing without retailer markups, and capture valuable customer data.
- With this data they create personalized marketing, creating a powerful feedback loop that strengthens the entire business model.

Competitor Risk Analysis
Execution: Lululemon’s DTC Prowess vs. Competitors’ Scale & Speed
- Lululemon’s Position: Lululemon’s vertically integrated, direct-to-consumer (DTC) model is its core strength, delivering high margins and brand control.
- Execution has faltered in America, which saw a 2% decline in comparable sales. (signals market saturation)
- Nike: Leverages immense global scale through wholesale partnerships for unmatched reach, while aggressively building its own DTC capabilities.
- Net profit margin : 9.43%
- Alo Yoga & Vuori: Are executing a similar premium DTC and are in a faster growth phase, rapidly opening stores in key urban markets to capture new customers.
- Alo Yoga net profit margin : 21%
- Vuori net profit margin : ~20%
- Adidas: Is showing strong momentum with a 13% revenue increase in Q1 2025, fueled by popular product lines and a rebound in brand heat.
- Adidas net profit margin : 3.23%
Unique Strategies: Community vs. Celebrity, Niche & Value
- Lululemon’s Strategy: Relies on its “Power of Three ×2” growth plan – ambassadors, local events, technical product education.
- Community model is harder to scale and less impactful against the massive marketing budgets and celebrity-driven appeal of competitors.
- Alo Yoga: Focuses on a “studio-to-street” aesthetic driven by high-profile celebrity and influencer marketing, positioning itself as the more fashion-forward, trend-setting brand.
- Vuori: Dominated premium men’s athleisure space by focusing on versatility and everyday comfort, creating a loyal following which Lululemon is still working to conquer.
- Nike: Continues its legacy strategy of using iconic athlete endorsements to create a global cultural connection that no other brand can replicate.
Reduced Spending & The Shift to “Cooler” Alternatives
- With consumer budgets tightening, the perceived value of paying a significant premium is diminishing. The question is no longer “is Lululemon the best?” but “is it worth the price difference?“
- Consumers now perceive less of a quality gap with competitors, making it harder to justify Lululemon’s premium price.
- As Lululemon has become mainstream – a perception of “sameness” has emerged, pushing consumers who crave newness and variety.
- Early adopters and fashion-forward consumers are moving towards newer, more niche brands to express individuality.

2030 Valuation
Assumptions :
- LTM Revenue: $10.75B
- 5Y Revenue CAGR: 18%
- 2030 Profit Margin: 15%
- 2030 PE Ratio: 15
- Shares outstanding: 0.12168B
- Shares reduction: 3%/year
Valuation :
- Q1 2031 LULU SHARE PRICE = 10.75 * (1.18)^5 * 0.15 * 15/ [0.12168 * (0.97)^5] = $529.65
- Using discount rate for LULU as 9%.
- CURRENT SHARE PRICE: $239.11
- DISCOUNT RATE: 9%
- FAIR VALUE: $529.65 / (1.09)^5 = $344.23
- POTENTIAL UPSIDE: (($344.23 – $239.11) / $239.11) × 100% ≈ 43.96%
- EXPECTED RETURNS: ((($529.65/ $239.11)^(1/5)) – 1) × 100% ≈ 17.25%/year
- DIVIDEND YIELD: NA
- MY RATING : Avoid🔴 | The returns are not justified considering the risks – Better opportunities with ROI are available in market currently.


