
TLDR;
- Revenue grew 7.5% in Q3 FY25 to $3.0B, but net profit slipped 1.4% with a 12.7% net margin.
- Margins weakened across operating and restaurant levels by ~1% YoY despite strong cash flow.
- Chipotle remains debt-free with a strong $1.8B cash position and $406M free cash flow.
- Traffic declined 0.8%, with digital sales at 36.7%, showing softening customer frequency.
- Stock dropped due to Gen Z & Millennial pullback, driven by unemployment, student loans, and slower wage growth.
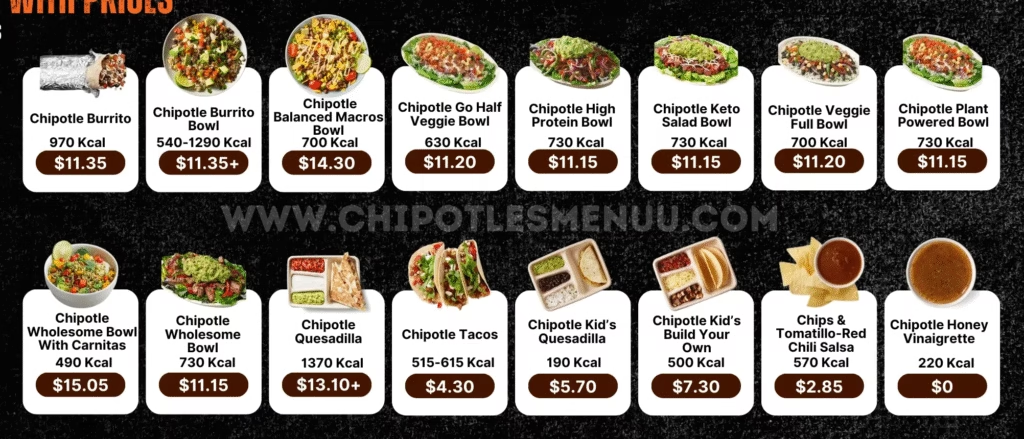
- Competitors’ $8–$11 meal deals highlight Chipotle’s $19+ bowls, hurting value perception.
- Customer frustration rising from app-only ordering, confusing promos, and shrinkflation (smaller portions, higher prices).
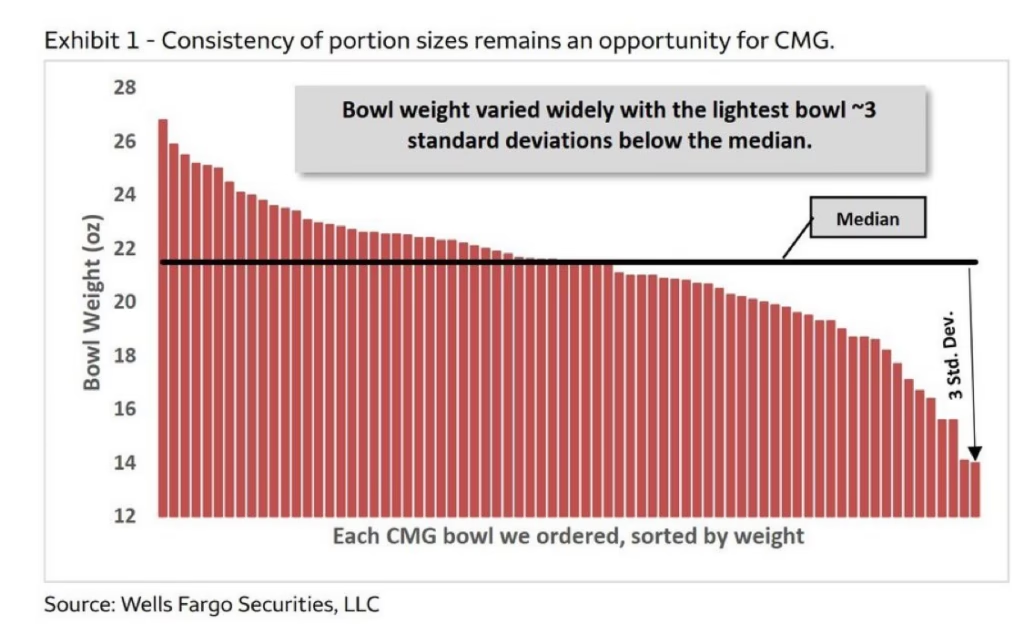
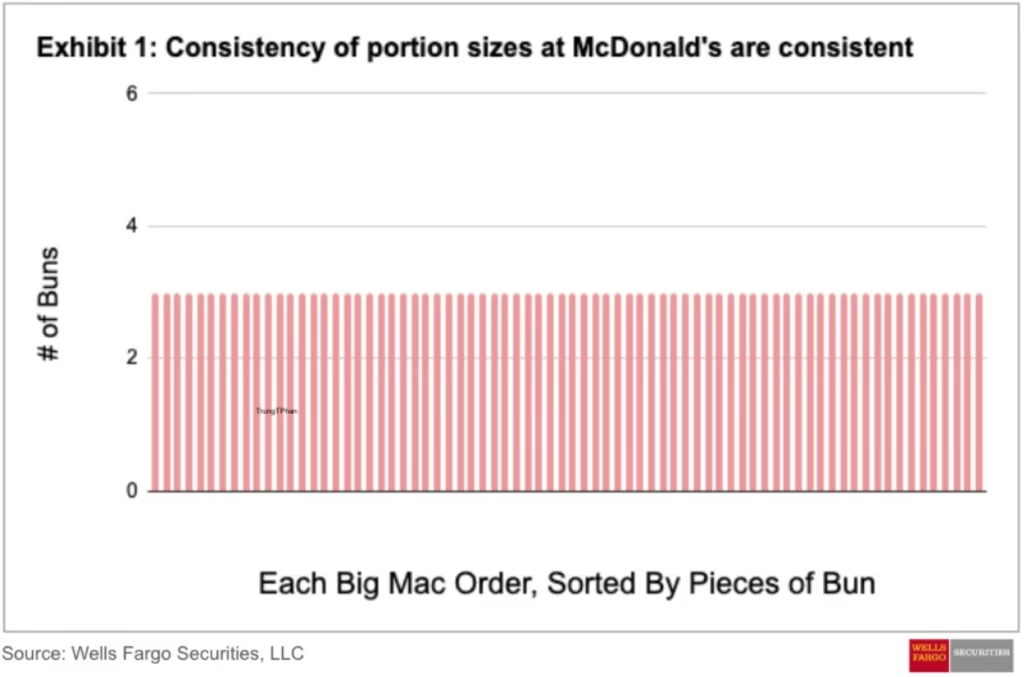
- Operational issues — inconsistent portions, messy lines, and poor prep — are eroding brand trust.
- Chipotle’s business model relies on high-throughput stores, digital loyalty, new unit growth, and tight menu discipline.
- Competitor risks vary: CAVA (similar model), Sweetgreen (unprofitable), Taco Bell/McDonald’s/Wendy’s (value-driven alternatives that capture budget-conscious customers).
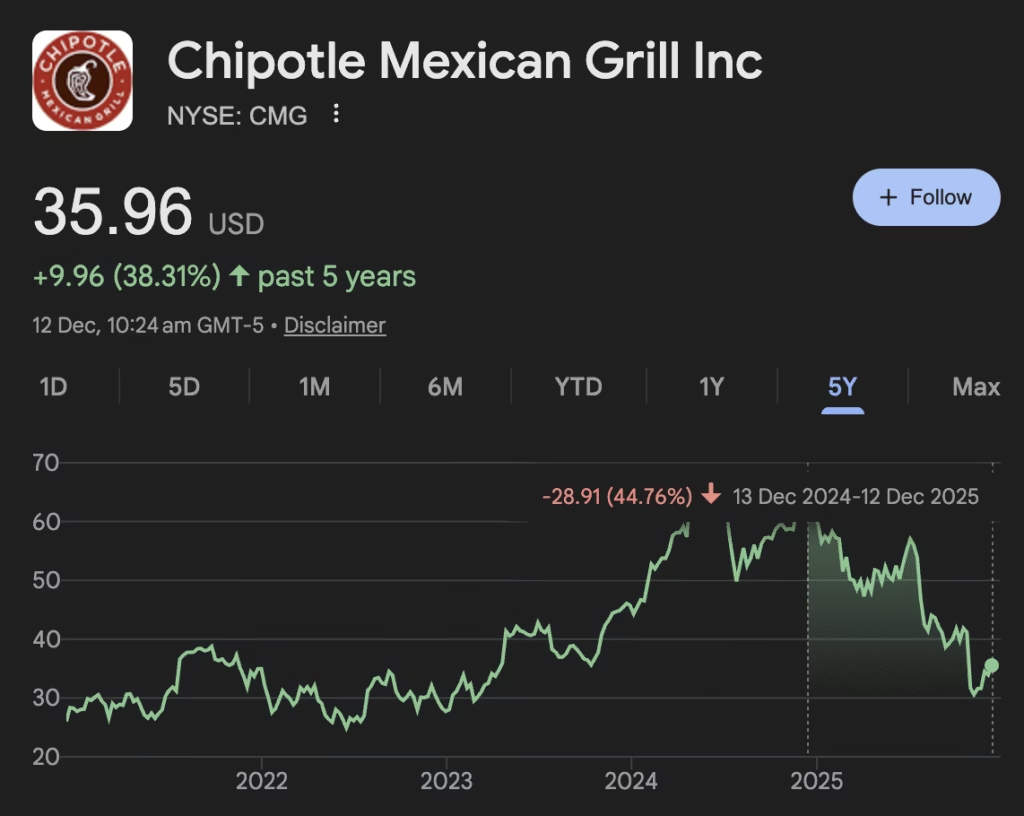
- Current stock price: $35 (12 Dec 2025)
- Rating: BUY ✅ | Accumulate on every 2-5% drop in price, with target of $73/share (~100% upside).
CMG Q3 FY25 Results:
- Revenue: $3.0B (+7.5% YoY)
- Net Profit: $382.1M (-1.4% YoY)
- Net Margin: 12.7%
- Operating Margin: 15.9% (-1.0% YoY vs. 16.9% in Q3 2024)
- Restaurant Level Operating Margin: 24.5% (-1.0% YoY vs. 25.5% in Q3 2024)
- Free Cash Flow (Q3): $406.2M
- Operating Cash Flow (Q3): $569.7M
- Cash & Securities Position: $1.8B (cash, restricted cash, and investments)
- Total Debt: $0 (debt-free)
- Food, Beverage & Packaging Costs: 30.0% of revenue (-0.6% YoY from 30.6%)
- Labor Costs: 25.0% of revenue (9M 2025)
- Share Repurchase (Q3): $687M at average price of $42.39 per share
- Transactions/Traffic: -0.8% YoY
- Digital Sales Mix: 36.7% of total food & beverage revenue
Why Chipotle Stock Fell?
- Gen Z and Millennials (ages 25-35) reduced visits due to unemployment, student loan repayments, and slower wage growth.
- Fast-food competitors launched aggressive $8-$11 meal deals, making Chipotle’s $19+ bowls appear expensive.
- Customer sentiment sharply declined with broad-based pullback in dining frequency across the industry.
- Chipotle is frustrating diners with app-only ordering policies and confusing promotions that add checkout friction.
- Provides smaller portions and higher menu prices (“shrinkflation”).
- Chipotle’s operational execution is slipping, leading to poor portion control, messy stores, and inconsistent prep that erodes trust.
How do they make money?
- Chipotle sells fast-casual Mexican food (burritos, bowls, tacos, salads) with a focus on high throughput, customization, and a simple, scalable menu.
- Mission: To cultivate a better world (with an emphasis on “Food with Integrity”)
- Core strategies:
- Throughput obsession – drive more transactions per hour via store layout, training, “Chipotlane” (drive-thru pickup), and faster make-lines.
- Digital + loyalty – grow app/web ordering and Rewards to lift frequency, personalization, and attach rates (guac, queso, drinks).
- New unit growth – expand restaurant count in North America and selectively internationally; prioritize strong unit economics and repeatable formats.
- Menu discipline – keep a tight core menu while using limited-time offers to create news and test demand without operational complexity.
- Product (what they sell):
- Entrées: burritos, burrito bowls, tacos, salads
- Add-ons: guacamole, queso, extra protein, chips & dips
- Beverages: fountain drinks, bottled drinks, sometimes alcohol (location dependent)
- Digital access: ordering via app/website + delivery marketplaces
- Catering / large orders (for groups and events)
Competitor Risk Analysis
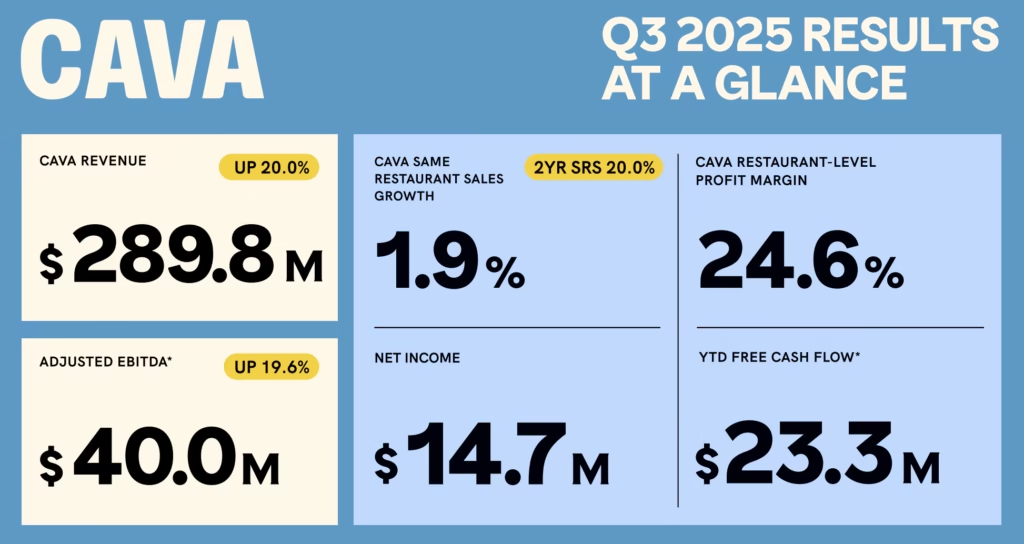
🥗 CAVA Group (CAVA)
- Type of Food : Mediterranean fast-casual: bowls, spreads, grilled proteins with olives, hummus, greens.
- Net Income Margin: 5.0%
- Restaurant-level profit margin ~24.6% (slightly below prior year).
- USP : Mediterranean-inspired health focus with premium ingredients and a fast-casual experience.
- Comparison with Chipotle
- Similar fast-casual positioning, but different cuisine focus (Mediterranean vs. Mexican).
- Margin profile is competitive with Chipotle, but CAVA has reported sales moderation amid macro pressure — risk of slowed demand among younger diners.
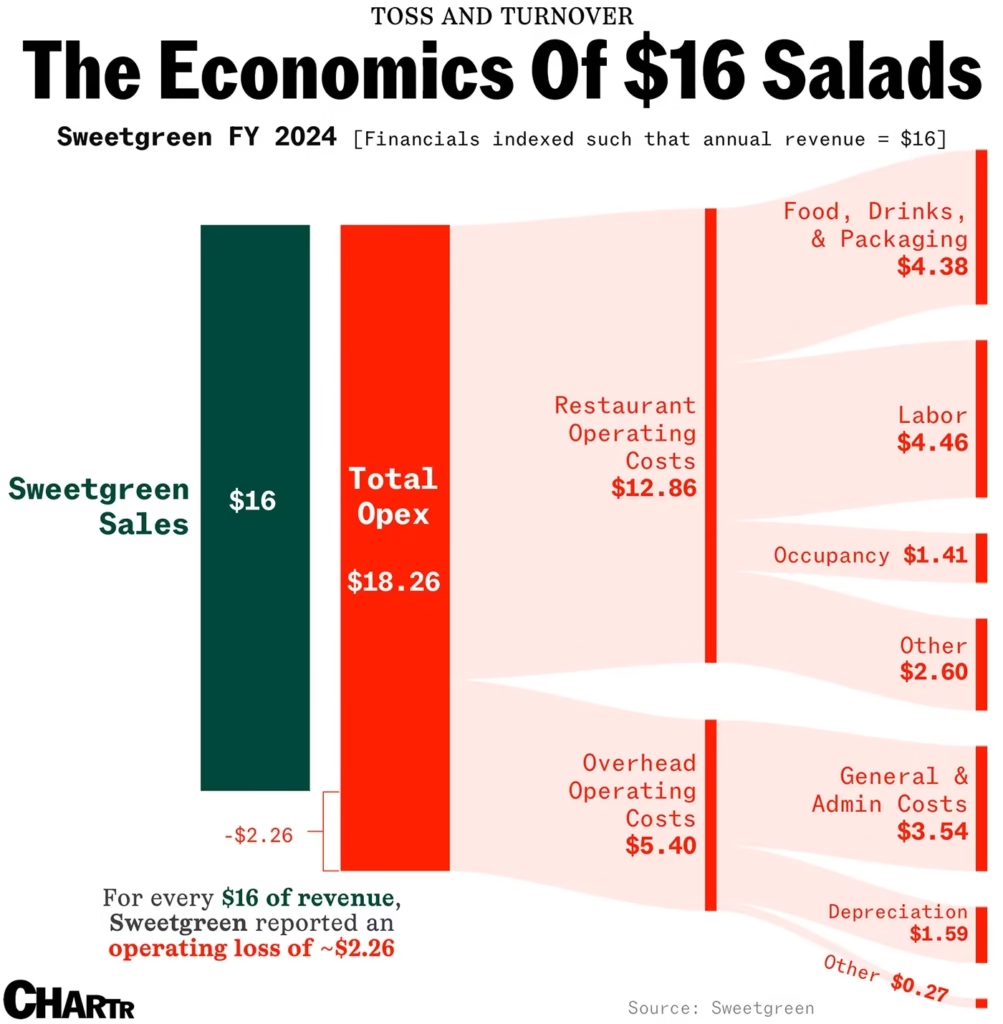
🥬 Sweetgreen
- Type of Food : Salad-centric fast-casual chain — made-to-order salads and grain bowls.
- Net Income Margin: -21.0% (a net loss of $36.1M on $172.4M in revenue)
- Restaurant-Level Profit Margin: 13.1%
- USP : Health-first positioning with focus on sustainability and seasonal produce (Farm-to-Table Sourcing).
- Comparison with Chipotle
🌮 Taco Bell (Parent : Yum! Brands)
- Type of Food : Quick-service Mexican-inspired menu: tacos, burritos, quesadillas, value-driven combos.
- Net Income Margin: Yum! Brands overall net margin ~12–18% range (Taco Bell is not separately reported).
- Restaurant-Level Profit Margin: 23.9% (Q3 2025)
- USP : Value pricing and extensive franchised global footprint with strong marketing and late-night positioning.
- Comparison with Chipotle
- Taco Bell targets value-focused, quick-serve customers with lower price points — a clear alternative when consumer spending tightens, unlike Chipotle’s premium stance.
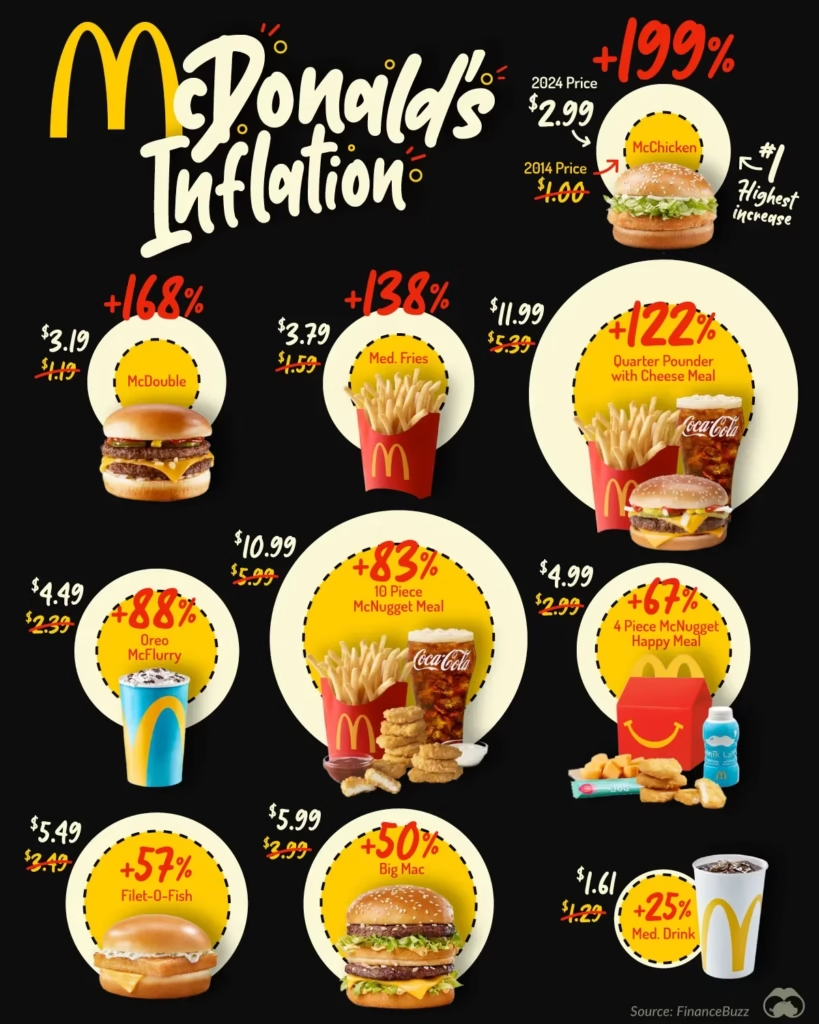
🍔 McDonald’s
- Type of Food : Classic fast-food: burgers, fries, breakfast items, value combos.
- Net Income Margin: ~32.2%.
- USP : Unmatched scale and value — high brand recognition, consistent global operations, strong value menus.
- Comparison with Chipotle
- McDonald’s competes on price and convenience, whereas Chipotle competes on quality and customisation — making McDonald’s a defensive choice in downturns.
🍟 Wendy’s
- Type of Food : Fast-food burgers, chicken sandwiches, salads, value combos.
- Net Income Margin: 8.05%
- Company-Operated Restaurant Margin: 13.1%
- USP : Square-patty burgers and differentiated menu with focus on quality relative to price.
- Comparison with Chipotle
- Wendy’s is positioned more as value-centric fast food with lower margins, making it more resilient in cost-sensitive markets but less aligned with premium, customizable fast-casual trends that benefit Chipotle.
2030 Valuation
Assumptions :
- LTM Revenue: $11.79B
- 5Y Revenue CAGR: 12.5%
- 2030 Profit Margin: 14%
- 2030 PE Ratio: 28
- Shares outstanding: 1.3B
- Shares reduction: 2.5%/year
Valuation :
- Q3 2031 CMG SHARE PRICE = 11.79 * (1.12.5)^5 * 0.14 * 28/ [1.3 * (0.97.5)^5] = ~$73
- CURRENT SHARE PRICE: $35
- POTENTIAL UPSIDE: (($73 – $35) / $35) × 100% ≈ 108.5%
- EXPECTED RETURNS: ((($73 / $35)^(1/5)) – 1) × 100% ≈ 15.8%/year
- DIVIDEND YIELD: NA
- MY RATING : BUY ✅ | Accumulate on every 1-5% drop in price.
