
TLDR;
- Customer Retention: Retention rate above 95% for 10th consecutive year.
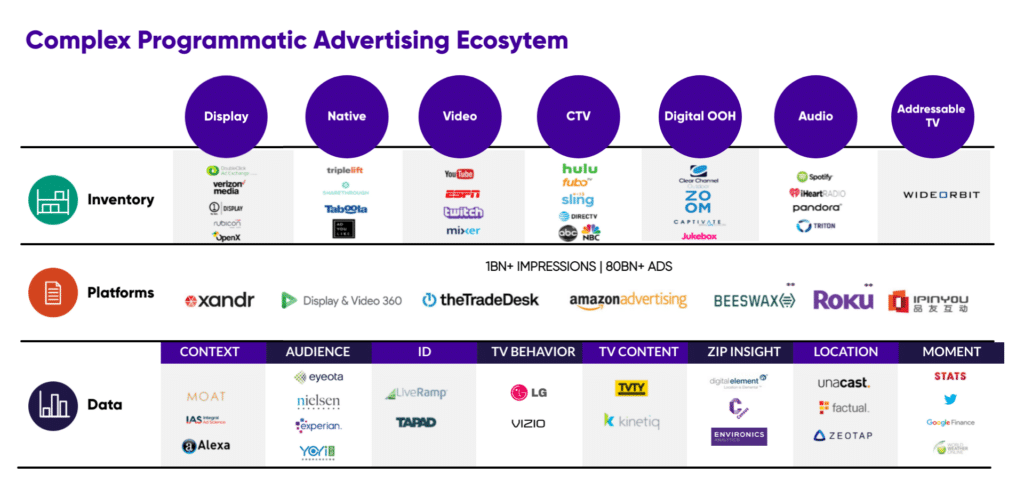
- Connected TV (CTV) Growth: largest and fastest-growing channel, with video ads comprising nearly 50% of the business.
- Unified ID 2.0 Partnerships: Expanded collaborations, including with Spotify and Roku, to enhance user privacy and advertising relevance.
- Slower rollout of TTD’s Kokai platform, impacted short-term performance
$TTD Q4 FY24 Results:
- Revenue: $741 million (+22% YoY)
- Net Income: $182 million (+88% YoY)
- Quarter Net Margin: 25%
- Cash Reserves: $1.36 B (+53% YoY).
- Share Repurchases: Authorized an additional $1 billion for future repurchases.
$TTD’s Business Model
1. Core Business: Open Internet Advertising
- Operates as a Demand-Side Platform (DSP), helping advertisers buy digital ad space efficiently.
- Competes against walled gardens (Google, Amazon, Meta) by supporting independent publishers.
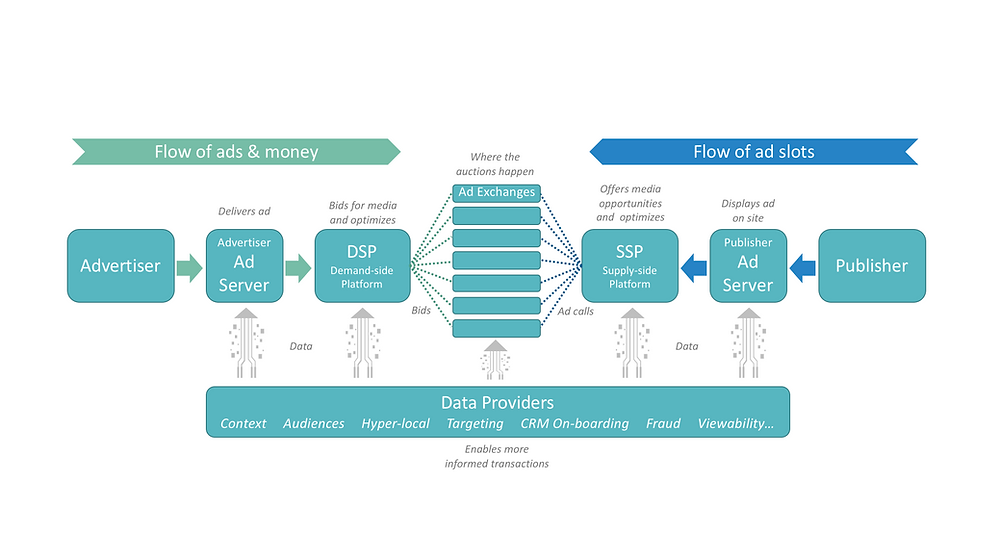
2. Ad Buying Process
- Publishers list ad slots on Supply-Side Platforms (SSPs) → SSPs push inventory to Ad Exchanges.
- TTD’s DSP connects to these exchanges, bidding on behalf of advertisers in real time.
- The highest bid wins, securing the ad placement.
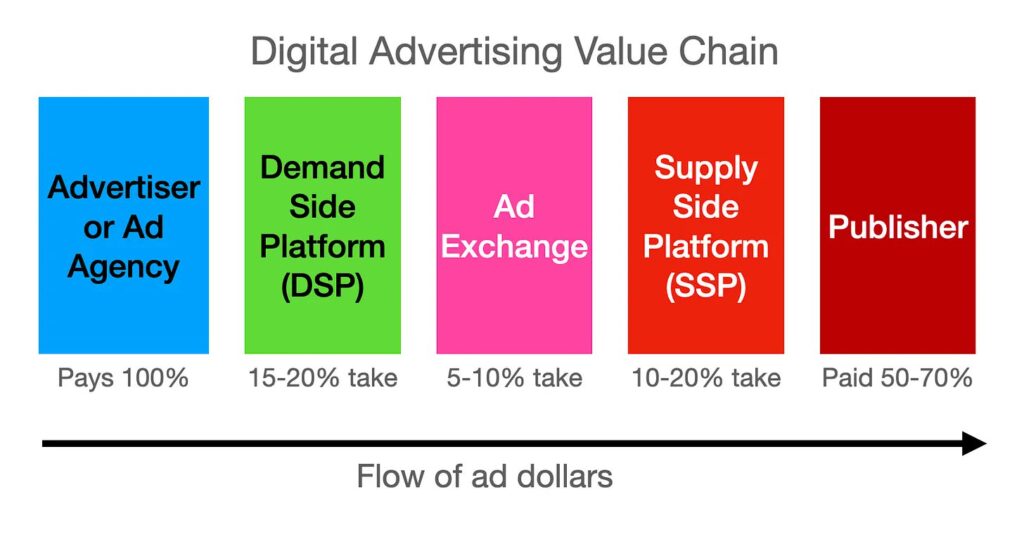
3. Revenue Model
- Commission-Based Earnings: Takes a cut from advertisers’ total ad spend.
- Positioned closest to advertisers in the ad supply chain, controlling significant budget flows.
- DSPs located closest to the money side in this chain:
4. Growth & Market Valuation
- Market undervalues its growth potential despite a 30x forward earnings valuation.
- Expanding into Connected TV (CTV) and privacy-focused ad solutions (UID 2.0) to stay competitive.
TTD’s Moat
- TTD Dominance: Third-largest demand-side platform (DSP) in open internet with 2% market share, offering long-term growth potential.
- Rapid Revenue Growth: 30% average annual revenue growth over 5 years, outpacing digital advertising industry.
- Strong Financials: Yearly 16% net margin, $1 billion net cash, and $2.9 billion equity provide financial stability.
- Superior Capital Allocation: 27% return on investment (ROI) exceeds industry average, driving profitable growth.
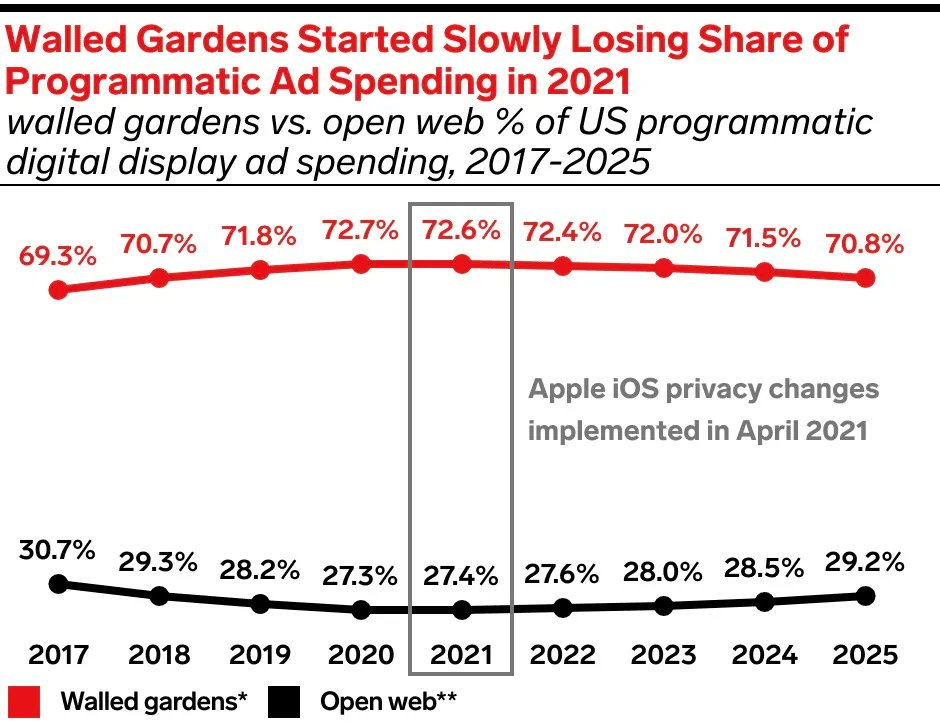
- Giant Opportunity Ahead: Walled gardens’ (Google, Meta, Amazon) declining market share and AI-driven traffic shift create $100 billion+ total addressable market (TAM) potential.
Competitor analysis
1. Growing Threat of Walled Gardens
- Google and Amazon dominate the digital ad space, leveraging vast data and integrated ecosystems.
- Amazon DSP (ADSP) is gaining traction in Connected TV (CTV) with lower tech fees than TTD.
- YouTube’s rise in CTV advertising further intensifies the competition.
2. Rising Competition from Applovin
- Applovin excels in in-app and in-game advertising, signaling alternative growth opportunities.
- Though it does not compete directly with TTD’s open-web focus, it attracts investor attention.
3. Internal Operational Challenges
- Slow adoption and criticism of TTD’s new Kokai interface due to UX issues and missing features.
- March 12, 2025: Sonos terminated its partnership for a TV stick powered by Ventura OS, derailing a key CTV initiative.
4. Strategic and Reputation Risks
- TTD’s OpenPath initiative bypassing SSPs raises concerns among publishers and advertisers.
- Criticism over TTD disregarding publisher-set price floors in ad bidding.
- UID 2.0, TTD’s single sign-on solution, struggles to gain adoption.
2030 Valuation (Updated on 5th April 2025)
Assumptions :
- LTM Revenue: $2.44B
- 5Y Revenue CAGR: 30%
- 2029 Profit Margin: 35%
- 2029 PE Ratio: 30
- Shares outstanding: 0.496B
- Shares reduction: 2%/year
Valuation :
- Q4 2030 TTD SHARE PRICE = 2.44* (1.30)^5 * 0.35 * 30 / [0.496 * (0.98)^5] = $212.17
- Using discount rate for TTD as 9%.
- CURRENT SHARE PRICE: $46.24
- DISCOUNT RATE: 9%
- FAIR VALUE: $212.17 / (1.09)^5 = $137.90
- POTENTIAL UPSIDE: (($137.90 – $46.24) / $46.24) × 100% = 198.23%
- EXPECTED RETURNS: ((($212.17 / $46.24)^(1/5)) – 1) × 100% ≈ 35.8%/year
- DIVIDEND YIELD: NA
- MY RATING: BUY ✅ | Accumulate only on red days while Trump is going crazy on tariffs.