TLDR;
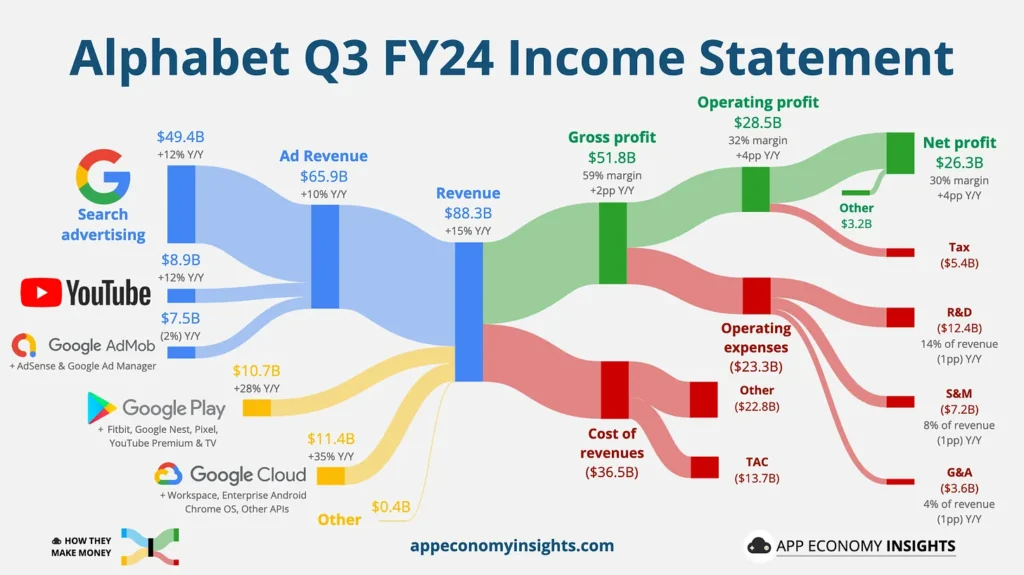
- Advertising: $65.9 billion (+10%, down from +11% in Q2).
- Search: $49.4 billion (+12%).
- YouTube ads: $8.9 billion (+12%).
- Network: $7.5 billion (-2%).
- Subscriptions, platforms, and devices: $10.7 billion (+28%).
- Cloud: $11.4 billion (+35%, accelerating from +29% in Q2).
- Small Buyback Increase.
- Cheap Valuation.
Google’s Q3 FY24 Results:
- Revenue grew +15% Y/Y to $88.3 billion ($2.0 billion beat).
- Gross margin was 59% (+2pp Y/Y).
- Earnings per share (EPS) was $2.12 ($0.27 beat).
- Operating cash flow was $30.7 billion (35% margin, -5pp Y/Y).
- Free cash flow was $17.6 billion (20% margin, -10pp Y/Y).
- Long-term debt: $13 billion.

Google Services Segment:
- Q3 revenue: $76.5 billion (87% of Alphabet’s total)
- Year-over-year growth: 12.5%
- Operating margin: 40.3% (up from 35.2% YoY)
Advertising Revenue:
- Total: $65.9 billion (75% of total revenue)
- Year-over-year growth: 10.4%
- Breakdown:
- Search: +12.2%
- YouTube Ads: +12.2%
- Google Network: declined 2% (9th consecutive quarter)
Competitive Landscape:
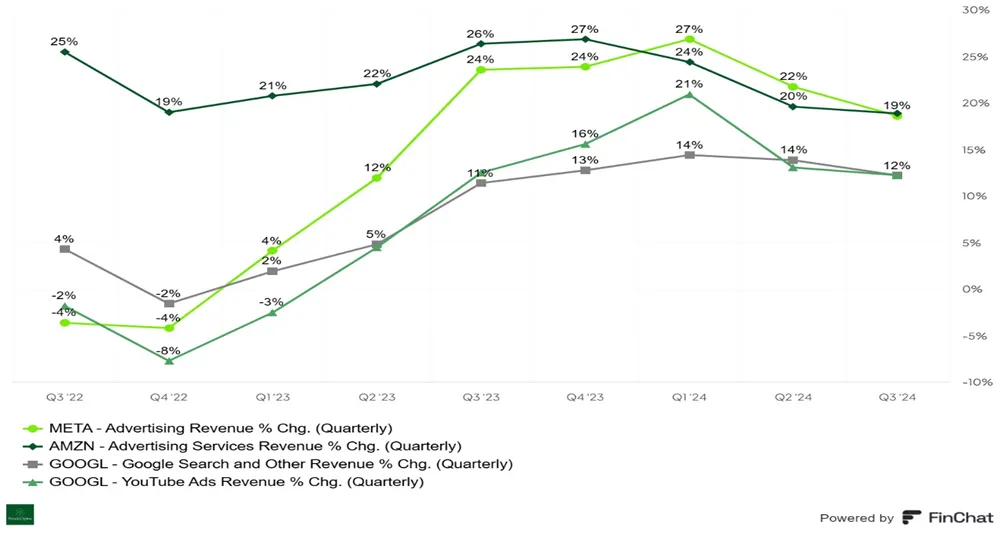
- Amazon’s ad revenue: $14.3 billion (+19% YoY)
- Meta’s ad revenue: $39.9 billion (+19% YoY)
- Intensifying competition for Google in digital ad spend.

Google Search Segment:
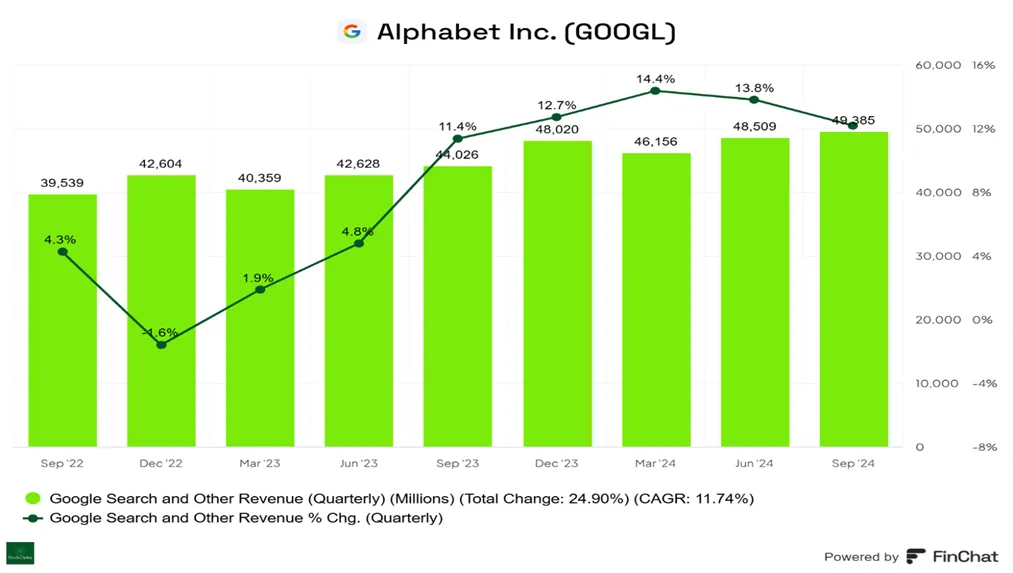
- Q3 2024 revenue: $49.4 billion
- Year-over-year growth: 12.2%
- Market share: 89.3% (down from 91.6% in Oct 2023)
Competitive Landscape:
- Microsoft Bing:
- Market share: 4.15% (up from 3.1% in Oct 2023)
- Modest gains, but still lagging behind Google
- Google vs. Bing:
- Google outperforms Bing in search revenue growth over the past 6 quarters.
- Google Search remains dominant despite generative AI concerns.

Positives:
- A strong first-mover advantage with Waymo.
- Cloud & enterprise products
- Consumer data – Android, maps, Gmail, Office docs
- Cash position and buybacks
- It has a near monopoly in Search
- Market leadership in media with YouTube.
Negatives:
- DoJ lawsuit & many other govs (e.g. EU) targeting the company.
- Declining search stats , direct impact on ad-revenues.
- In consumer products area – no new ‘wow’ product since 10 years.
- Lower FCF Due to higher Capex.
2029 Valuation
Assumptions :
- LTM Revenue: $328.284B
- 5Y Revenue CAGR: 9%
- 2029 Profit Margin: 28%
- 2029 PE Ratio: 22
- Shares outstanding: 12.581B
- Shares reduction: 2.5%/year
Valuation :
- Q2 2029 GOOGLE SHARE PRICE = 328.284 * (1.09)^5 * 0.28 * 22 / [12.581 * (0.975)^5] = $281
- Using discount rate for Google as 9%.
- CURRENT SHARE PRICE: $172
- DISCOUNT RATE: 6%
- FAIR VALUE: $281 / (1.06)^5 = $210
- POTENTIAL UPSIDE: (($210 – $172) / $172) × 100% = 22%
- EXPECTED RETURNS: ((($281 / $172)^(1/5)) – 1) × 100% ≈ 6.5%/year
- DIVIDEND YIELD: 0.53%
- MY RATING: Wait for consolidation 🟡 (~$150)|, for conservative buyers : Accumulate on red days.


