TLDR;
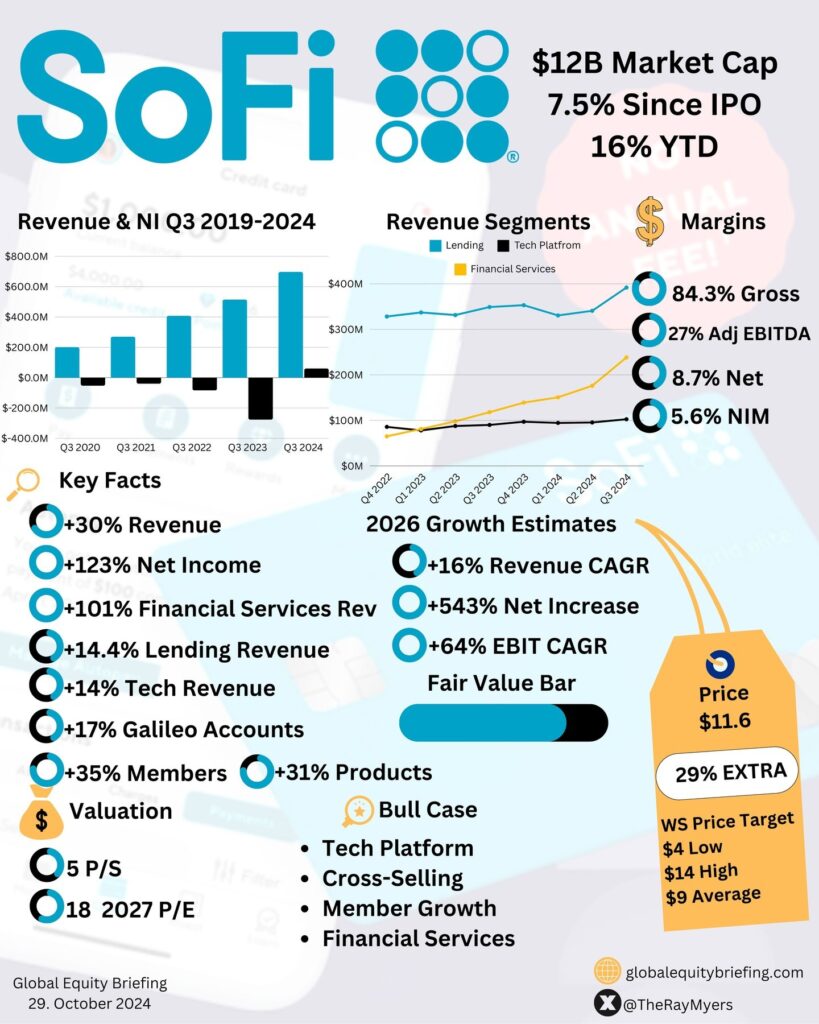
- $689M Revenue +30%
- $61M Net Income +123%
- Inflecting Profitability
- Supreme Financial Services Growth
- Amazing Member and Products Growth
- Reasonable Valuation
SoFi Q3 FY24 Results:
- Membership Growth: 750,000 new members added, reaching 9.4M (35% YoY growth).
- Product Expansion: 1.1M new products added, totaling 13.7M (31% YoY growth).
- Tech Revenue: 14% YoY growth, contributing $30M to operating income.
- Financial Services: Revenue doubled YoY to $238M from $118M.
- Net Interest Income: $431M (+25% YoY).
- Average Interest-Earning Assets: +35% YoY.
- Average Yields: -44 basis points YoY.
- Net Interest Margin: 5.57% (vs. 5.99% YoY).

Q3 Product Highlights
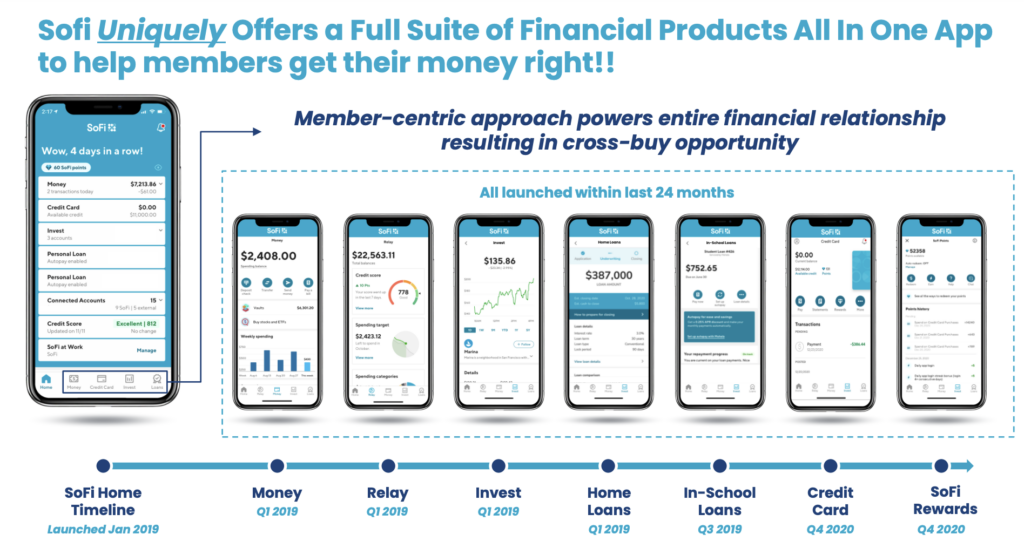
- SoFi Money: Record accounts, deposits, and direct deposit members.
- SoFi Invest: Strong engagement driven by new investment products.
- SoFi Credit Card: Launched Everyday Cash Rewards and Essential cards.
- Loan Platform: $1B personal loan volume, record results.
- Tech Platform: New partnerships, fraud protection, and secured credit offerings.
- Home Loans: Best refinancing quarter since Q2 2022 (+23% sequentially).
- Credit Performance: Improved delinquencies (57bps) and net charge-offs (3.52%).
- Brand Awareness: +40% YoY, highest ever average unaided awareness.

SoFi’s Strong Loan Portfolio
- Borrower Profile: Average income $150,000+, average FICO score 740+.
- SoFi’s Creditworthiness rule: Minimum FICO score 680 for lending.
- Charge-off Rate: 2.7% (Q1 2023).
- Expected Loan Losses: 4.5% (portfolio life).
- Personal Loans Originated: $1B (on behalf of third parties).
- Servicing Cash Flow: $5.5M.
- Adjusted Net Revenue Contribution: $61.1M.

Financial Services Segment
- Revenue Growth: $238M (+66% YoY).
- Non-Interest Income: $84M (35% of revenue).
- Expense Growth: 20% (despite revenue doubling).
- Contribution Margin: 42% (up from 3% YoY).
- Operating Leverage: Significant improvement.
- Transition to fee based revenue streams brings significant operating leverage

2029 Valuation
Assumptions :
- LTM Revenue: $3.52B
- 5Y Revenue CAGR: 55.34%
- 2029 Profit Margin: 5.07%
- 2029 PE Ratio: 10
- Shares outstanding: 1.104B
- Shares reduction: 10%/year
Valuation :
- Q3 2029 SoFi SHARE PRICE = 3.52 * (1.55)^5 * 0.0507 * 12 / [1.104 * (0.90)^5] = $25
- Using discount rate for SoFi as 9%.
- CURRENT SHARE PRICE: $14.61
- DISCOUNT RATE: 9%
- FAIR VALUE: $25 / (1.09)^5 = $16.27
- POTENTIAL UPSIDE: (($16.27 – $14.61) / $14.61) × 100% = 11.37%
- EXPECTED RETURNS: ((($25 / $14.61)^(1/5)) – 1) × 100% ≈ 9%/year
- DIVIDEND YIELD: NA
- MY RATING: BUY ✅ | Accumulate only on red days.


